
Detailed Guide to Getting Started with Windows ETW
Detailed Guide to Getting Started with Windows ETW
Disclaimer: The following content is based on information from the internet and some of my own notes, aimed at a more comprehensive study and recording of ETW-related knowledge.
Environment
- Operating System: Windows 10 21H1
Introduction to ETW
History
ETW (Event Tracing for Windows) was first introduced in Windows 2000, after which the operating system core and services began using ETW to log events. After Windows Vista, ETW introduced a unified event provider model and API, and it was further enhanced in Windows 7.
Due to ETW's functional and performance advantages, third-party logging systems gradually lost their edge. Advantages of ETW include:
Separation of process and ETW session: Application crashes do not affect ETW. This is because ETW uses separate system resources and mechanisms to log events, ensuring that ETW can operate normally even if the application crashes.
Dynamic enable and disable logging: Can be adjusted at runtime. This means users can enable or disable specific logging at any time based on their needs. For example, when the system encounters an anomaly, administrators can immediately enable more logging to facilitate detailed troubleshooting.
Low resource consumption: Almost no system resources are consumed when event tracking is turned off. This is because ETW is in an idle state without logging enabled, not occupying CPU or memory resources.
Custom message format: Easy to extend. For example, developers can define their own event types and data formats to log specific application or system operations, making ETW adaptable to different needs and scenarios.
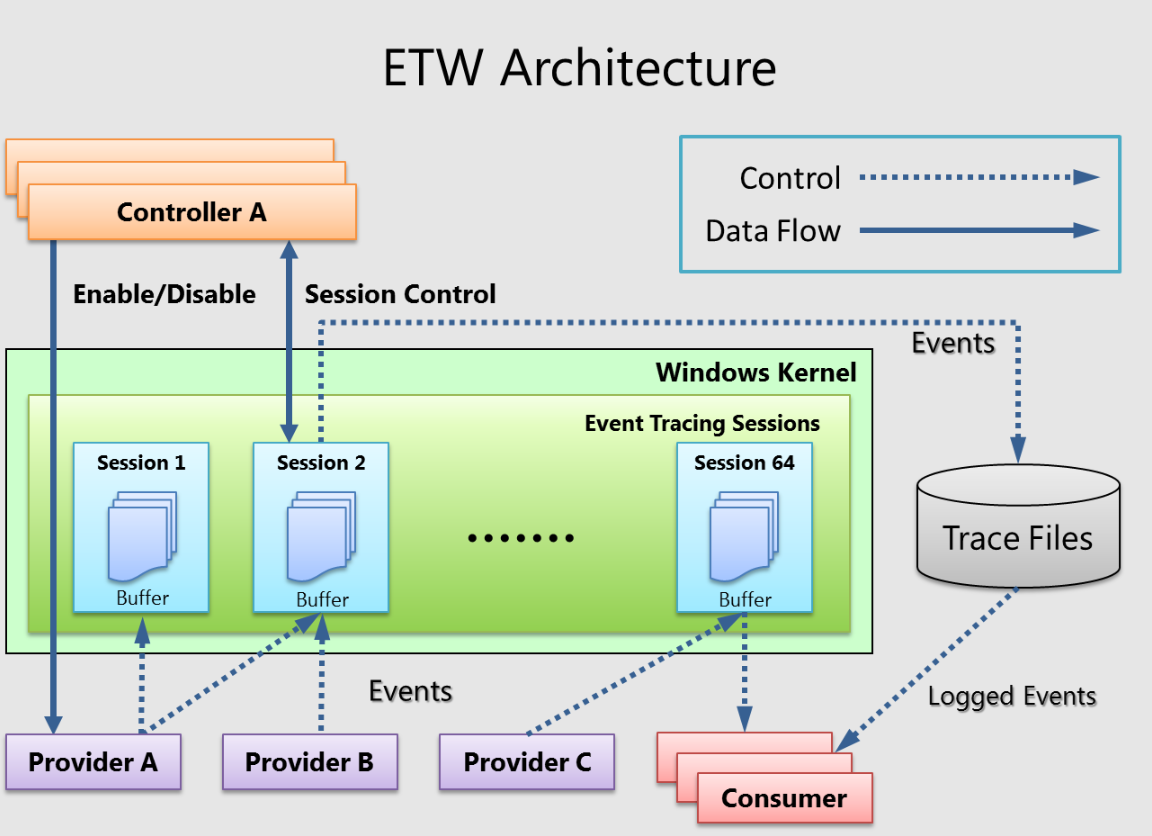
Operating Mechanism
The operation of ETW mainly consists of five important roles and components: Provider , Session , Controller , Consumer , and Buffer .
 |
|---|
| Link |
A provider is an instrumented component used to generate events. Providers can be user-mode applications, kernel-mode drivers, or the Windows kernel itself. In addition to fixed event data (headers), events can also carry user data.
Events are data representations based on occurrences . Data can be used for in-depth analysis. Events can also be used to generate counters . Counters provide a sample-based view of data , usually containing a small set of data to show the current state, such as the number of I/O bytes per second and the number of interrupts per second.
Providers must register with ETW and send events by calling the ETW Logging API . Providers register a callback function to receive enable and disable notifications, allowing for dynamic enabling and disabling of tracking.
A session acts as an intermediary agent in the ETW infrastructure, forwarding events from one or more providers to consumers . A session is a kernel object that collects events into kernel buffers and sends them to specified files or real-time consumer programs . Multiple providers can be mapped to a single session , allowing users to collect data from multiple sources.
Controllers are responsible for starting , stopping , or updating a tracing session. A session is a unit of tracing. Providers are mapped (or enabled) to specific sessions. Controllers enable and disable providers, allowing them to start sending events to ETW. Controller functionality can be invoked through Microsoft-provided tools or custom applications.
Logman.exeis a built-in controller application.Windows Performance Recorder (WPR) is a recommended controller process in the Windows performance toolkit.
Consumers are applications that read recorded trace files (ETL files) or capture events in real-time from active tracing sessions and process the events. Event Viewer and Resource Monitor are built-in ETW consumer applications.
- Windows Performance Analyzer (WPA) is a recommended consumer process in the Windows performance toolkit.
Buffers are an important part of an ETW session, used to temporarily store event data. When event data is generated by providers, it is first stored in buffers and then transmitted by the session to specified files or real-time consumer programs. Buffers ensure stable and efficient data transmission.
Practical Uses
Blue Team Applications
- The Blue Team can utilize ETW's callback mechanism to passively and instantly receive events. For example, the Microsoft-Windows-Threat-Intelligence provider is an event provider that can monitor AllocationType events, RegionSizes events, ProtectionMask events, and other information. These parameters are as follows:
AllocationType: Indicates the type of memory allocation.RegionSizes: Indicates the size of the memory region.ProtectionMask: Indicates the protection attributes of the memory region, such as readable, writable, and executable.
- If a memory region is found to have readable, writable, and executable attributes, it may be the behavior of malicious software. Additionally, the Blue Team can use the Microsoft-Windows-Kernel-Registry provider to monitor persistence behaviors implemented through the registry, such as writing to the following registry keys:
- Registry : The registry is a centralized database in the Windows operating system used to store configuration information , application settings , and system options . It allows applications and the operating system to share information, ensuring system stability and consistency.
RunOnce: Programs run only once at the next system startup.Run: Programs run every time the system starts.RunServices: Services run every time the system starts.
Red Team Applications
The Red Team also has corresponding countermeasures to bypass ETW . In user mode (Ring3), the EtwEventWrite function can be hooked to intercept event writing, or EtwEventUnregister can be used to unregister ETW events. In kernel mode (Ring0), the GITL (Ghost In The Logs) method can be used to bypass ETW by hooking the kernel API NtTraceEvent.
In computer architecture, the Ring model divides system operation permissions into different levels, with Ring0 having the highest permissions, usually running kernel-mode code; Ring3 has the lowest permissions, running user-mode code. This design protects the system from damage by low-permission code.
Ghost In The Logs is a technique to bypass ETW by hooking (intercepting and modifying) the kernel API NtTraceEvent, so that specific events are not logged or modified, thereby hiding malicious activities.
Bypassing here refers to using technical means to make certain operations not be logged or monitored normally, thereby hiding behaviors. For example, malicious software bypasses ETW monitoring during execution, making its behavior undetected by the security system.
| Blue Team Applications | Red Team Applications |
|---|---|
| Utilize ETW's callback mechanism to passively and instantly receive events | Hook the EtwEventWrite function to intercept event writing, or use EtwEventUnregister to unregister ETW events |
| Use Microsoft-Windows-Threat-Intelligence provider to monitor memory allocation, region sizes, and protection attributes | Use the GITL (Ghost In The Logs) method by hooking the kernel API NtTraceEvent to bypass ETW |
| Use Microsoft-Windows-Kernel-Registry provider to monitor changes to registry keys |
ETW Tools
Introduction
Windows provides a built-in tool - Logman, used to view provider information and session status, and create sessions to receive events.
Usage
View All Providers
- Use the command
logman query providersto view all providers. The output will display the provider names and GUIDs.
View Specific Provider
- To find out the details of a specific provider, add the provider name or GUID after the command, such as
logman query providers <provider name>orlogman query providers <GUID>. The return result will display the provider's event flags and security level information.
Using Sessions
- Create a session:
logman create trace <session name> -p <provider name / GUID> <flags> <security level> -o <path to log file> - Start a session:
logman start <session name> - Stop a session:
logman stop <session name> - Delete a session:
logman delete <session name>
For example, create a session using the Microsoft-Windows-Kernel-Process provider:
1 | logman create trace example -p Microsoft-Windows-Kernel-Process 0x10 0x4 -o C:\example.etl |
The generated ETL file can be converted to an XML file using tracerpt :
1 | tracerpt example.etl -o example.xml |
Open the XML file, and you should see the event records generated by the previously executed commands.
Example of Capturing and Analyzing Events Using KrabsETW and JSON Libraries
Below is an example program using KrabsETW and JSON libraries to capture and analyze events:
1 |
|
This program will create a session and receive events from the Microsoft-Windows-Kernel-Process provider, parsing and outputting them in JSON format.
Example of Implementing Detection Bypass
Below is an example program of bypassing ETW detection:
1 |
|
This program modifies the ETW behavior of PowerShell to no longer log events.
Advanced Use: Real-time Event Capture and Analysis
Below is a more advanced example demonstrating how to capture and analyze events in real-time using ETW:
Preparation
Install KrabsETW and JSON libraries
1
2
vcpkg.exe install nlohmann-json:x64-windows
vcpkg.exe install krabsetw:x64-windows
Set Provider and Create Session
1 |
|
The above code demonstrates how to create an ETW session and capture and analyze events in real-time. This is very helpful for those who need to understand system operations and perform security analysis in-depth.
Conclusion
ETW is a powerful event tracing mechanism on the Windows platform, valuable for both Blue and Red Teams. By understanding its operating mechanism and usage methods, we can better utilize ETW for system monitoring and security analysis. I hope this article helps you quickly get started with ETW and become an expert in this field in the future.