
2019 Trendmicro CTF Wildcard 400
2019 Trendmicro CTF Wildcard 400
這篇文章是我練習 2019 Trendmicro CTF Wildcard 400 這個題目時紀錄的解題筆記,我把一些參考資源放在文章最後面。
Permise ( 前情提要 )
You are a network security administrator for the medium sized business XYZcorp. You often use network flow data to uncover anomalous security events. This challenge provides some sample aggregated data on flows, and uses answers from the anomalous ( 反常的 ) events to construct the flag.
Knowledge of network security or protocols is not required. This challenge requires data stacking, slicing, and/or anomaly detection.
Data
Timestamp, src, dst, port, bytes.
Internal hosts have IPs beginning with 12~14.
External IPs include everything else.
Challenges
Question 1: Discover Data Exfiltration 1
Our intellectual property is leaving the building in large chunks. A machine inside is being used to send out all of our widget designs. One host is sending out much more data from the enterprise than the others. What is its IP?
根據題目我們可以知道我們要找到送出 大量資料 的 IP 。
不過在開始對資料進行搜尋之前,我們可以先把資料做一些預處理,方便我們後續的操作。
先 import 一些可能會用到的套件:
1
2
3
4
import pandas as pd
import numpy as np
import matplotlib.pyplot as plt
import gc匯入所要分析的檔案先大致查看一下檔案:
1
2
3
df = pd.read_csv('/kaggle/input/2019-trendmicro-ctf-wildcard-400/gowiththeflow_20190826.csv')
df.info()
df.head(10)1
2
3
4
5
6
7
8
9
10
11
12<class 'pandas.core.frame.DataFrame'>
RangeIndex: 105747729 entries, 0 to 105747728
Data columns (total 5 columns):
# Column Dtype
--- ------ -----
0 1578326400001 int64
1 13.43.52.51 object
2 18.70.112.62 object
3 40 int64
4 57354 int64
dtypes: int64(3), object(2)
memory usage: 3.9+ GB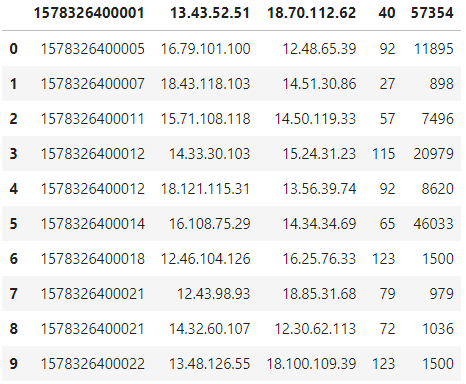
- 可以看到第一行是數據,我們可以把它改成欄位資訊,這樣可以方便我們之後對資料的相關操作。
再次匯入檔案,並且插入欄位資料:
1
2
3
4
5
6
7
8df = pd.read_csv(
'/kaggle/input/2019-trendmicro-ctf-wildcard-400/gowiththeflow_20190826.csv',
header = None,
# Timestamp, Source, Destination, Port, Bytes
names= ['timestamp', 'src', 'dst', 'port', 'bytes']
)
df.info()
df.head(10)1
2
3
4
5
6
7
8
9
10
11
12<class 'pandas.core.frame.DataFrame'>
RangeIndex: 105747730 entries, 0 to 105747729
Data columns (total 5 columns):
# Column Dtype
--- ------ -----
0 timestamp int64
1 src object
2 dst object
3 port int64
4 bytes int64
dtypes: int64(3), object(2)
memory usage: 3.9+ GB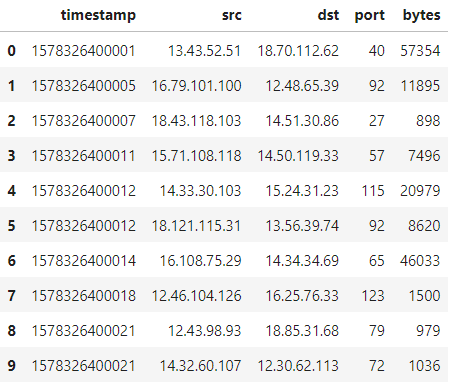
定義一個過濾 IP 的 function 、修改一些欄位的 type 並且增加了
src_int和dst_int這兩個欄位:1
2
3
4
5
6
7
8
9
10
11
12gc.collect()
def is_internal(s):
return s.str.startswith(('12.', '13.', '14.'))
df['src_int'] = is_internal(df['src'])
df['dst_int'] = is_internal(df['dst'])
df['timestamp'] = pd.to_datetime(df.timestamp, unit='ms')
df['hour'] = df.timestamp.dt.hour.astype('uint8')
df['minute'] = df.timestamp.dt.minute.astype('uint8')
df['port'] = df['port'].astype('uint8')
df.head(10)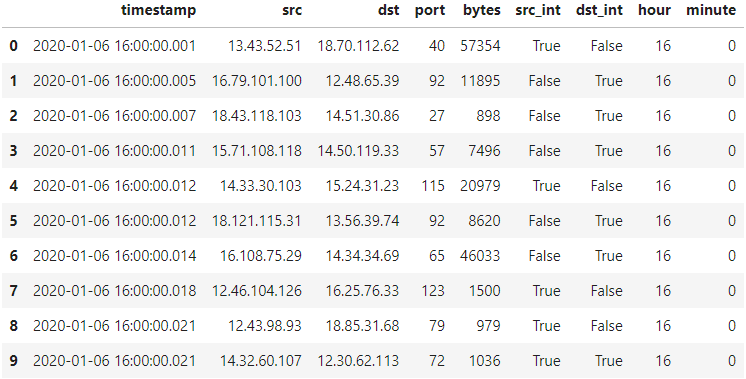
is_internal這個 function 過濾了由 12, 13, 14 開頭的 IP ,因為題目 Data 說明有說 12~14 開頭的 IP 是 internal IP 。新增
src_int來記錄該 row 的src欄位值是否為 internal IP 。新增
dst_int來記錄該 row 的dst欄位值是否為 internal IP 。
把 IP 相關的資料類型轉成 category :
1
2
3
4
5
6
7
8
9
10
11gc.collect()
all_ips = set(df['src'].unique()) | set(df['dst'].unique())
print('Unique src:', df['src'].nunique())
print('Unique dst:', df['dst'].nunique())
print('Total Unique IPs:', len(all_ips))
ip_type = pd.CategoricalDtype(categories=all_ips)
df['src'] = df['src'].astype(ip_type)
df['dst'] = df['dst'].astype(ip_type)
df.info()1
2
3
4
5
6
7
8
9
10
11
12
13
14
15
16
17
18
19Unique src: 6171
Unique dst: 6005
Total Unique IPs: 6177
<class 'pandas.core.frame.DataFrame'>
RangeIndex: 105747730 entries, 0 to 105747729
Data columns (total 9 columns):
# Column Dtype
--- ------ -----
0 timestamp datetime64[ns]
1 src category
2 dst category
3 port uint8
4 bytes int64
5 src_int bool
6 dst_int bool
7 hour uint8
8 minute uint8
dtypes: bool(2), category(2), datetime64[ns](1), int64(1), uint8(3)
memory usage: 2.5 GB這邊解釋一下程式細節:
找出總共出現過幾種 IP :
1
all_ips = set(df['src'].unique()) | set(df['dst'].unique())
轉換資料類型:
1
2
3ip_type = pd.CategoricalDtype(categories=all_ips)
df['src'] = df['src'].astype(ip_type)
df['dst'] = df['dst'].astype(ip_type)
到這邊預處理的動作也做得差不多了可以開始實作題目了,這邊先創建兩個 list 一個是拿來存答案的,一個是拿來記錄我們所找到的可疑 IP :
1
2
3gc.collect()
blacklist_ips = []
answers = []回顧一下 Question 1 我們要找到送出 大量資料 的 IP 。
查找出可疑 IP :
1
2
3
4
5
6
7
8
9
10
11
12src_bytes_out = df[df['src_int'] & ~df['dst_int']]\
.groupby('src')\
.bytes.sum()\
.sort_values(ascending=False)
print(type(src_bytes_out))
print(src_bytes_out.to_frame().head(10))
src_bytes_out.head(10)\
.sort_values()\
.plot.barh(title='Outbound Traffic')\
.set_xlabel('Outbound Bytes')1
2
3
4
5
6
7
8
9
10
11
12
13
14<class 'pandas.core.series.Series'>
bytes
src
13.37.84.125 10625497574
13.48.72.30 1727525696
14.51.75.107 1656207638
14.51.30.86 1647330708
12.59.25.34 1617316039
12.56.32.111 1600604429
14.57.50.29 1589314261
13.39.46.94 1576854685
12.58.68.102 1545945975
12.45.94.34 1501437235
Text(0.5, 0, 'Outbound Bytes')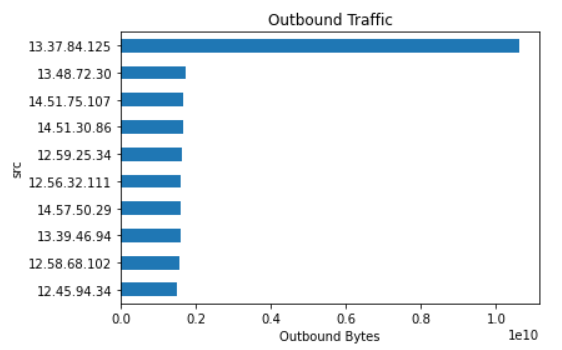
這邊我利用了
df['src_int'] & ~df['dst_int']這個 Boolean Series 來過濾出由內到外的流量。用
.groupby('src')把資料以src統整起來,並且再用.bytes.sum()把相同src的bytes欄位的值加總。.sort_values(ascending=False)表示我要由大到小排序資料。to_frame可以把 series 類型,轉成 dataframe 類型。而我們可以根據分析結果知道可疑的 IP 應該就是
13.37.84.125,因為送出了大量的資料,相異於大部分的 IP 。
以頻率圖來視覺化分析結果:
1
2
3
4
5
6ax = src_bytes_out\
.plot.hist(bins=50, title='Outbound Traffic')
ax.set_xlabel('Outbound Bytes')
ax.axvline(src_bytes_out.iloc[0], linestyle='--')
plt.text(src_bytes_out.iloc[0], 1000, '13.37.84.125', rotation=90, horizontalalignment='right')1
Text(10625497574, 1000, '13.37.84.125')
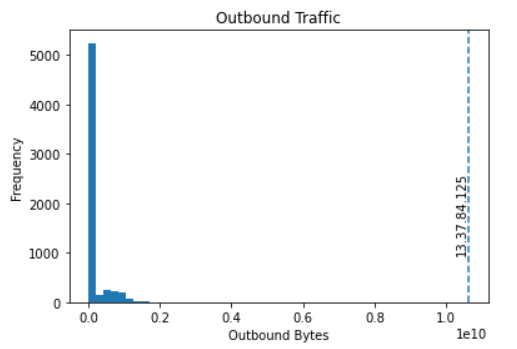
這邊可以看出大致上每個 Host ( IP ) 的 正常外流流量 的大小照理說應該是多大,我以頻率為 y 軸,這樣就把圖拉長成 2D 圖方便觀察:
標記
13.37.84.125,可以明顯看到該 IP 異常,plt.text裡的前 2 個值就是在設定字串13.37.84.125要放置的座標位置: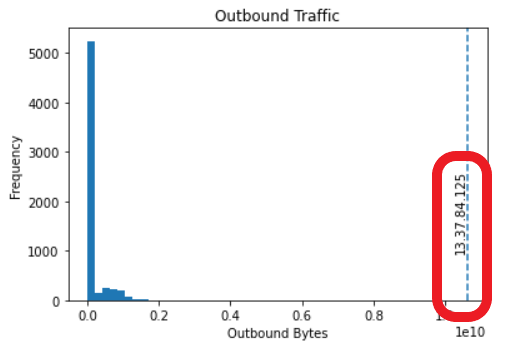
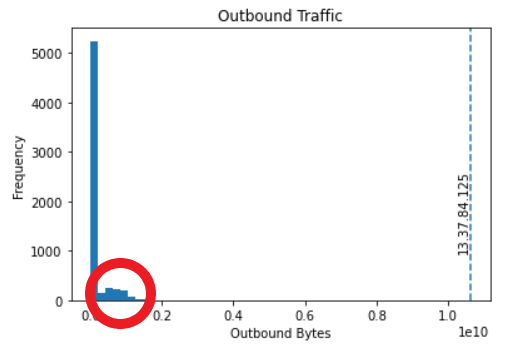
不過這邊注意到一個問題,左邊有一個很長的 bar ,應該代表記錄了許多傳輸出 0 byte 的資訊,我們可以把這些資訊過濾掉。
過濾掉 0 byte 的數據並重新畫圖:
1
2
3
4
5
6
7
8
9
10
11
12
13
14src_bytes_out_2 = df[df['src_int'] & ~df['dst_int']]\
.groupby('src')\
.bytes.sum()\
.pipe(lambda x : x[x > 0])\
.sort_values(ascending=False)
print(src_bytes_out_2.to_frame().head(10))
ax = src_bytes_out_2\
.plot.hist(bins=50, title='Outbound Traffic')
ax.set_xlabel('Outbound Bytes')
ax.axvline(src_bytes_out_2.iloc[0], linestyle='--')
plt.text(src_bytes_out_2.iloc[0], 75, '13.37.84.125', rotation=90, horizontalalignment='right')1
2
3
4
5
6
7
8
9
10
11
12
13bytes
src
13.37.84.125 10625497574
13.48.72.30 1727525696
14.51.75.107 1656207638
14.51.30.86 1647330708
12.59.25.34 1617316039
12.56.32.111 1600604429
14.57.50.29 1589314261
13.39.46.94 1576854685
12.58.68.102 1545945975
12.45.94.34 1501437235
Text(10625497574, 75, '13.37.84.125')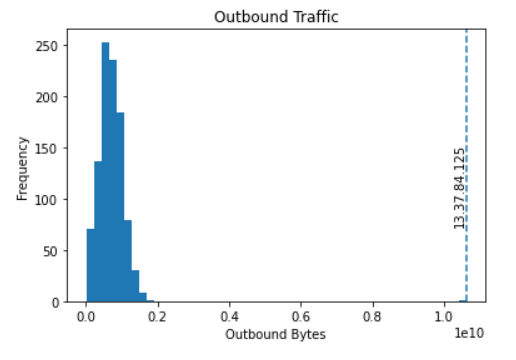
這段程式碼中我加上了
.pipe(lambda x : x[x > 0])用來過濾加總後的 byte 小於等於 0 的數據,輸入參數為 x series ,x[x > 0])代表對 x series 進行過濾篩選,篩選條件是 x series 內元素的值大於 0 者。過濾篩選過後跑出來的圖應該就更可以清楚觀察流量頻率了。
把答案記錄下來:
1
2
3gc.collect()
blacklist_ips.append('13.37.84.125')
answers.append('13.37.84.125')
Question 2: Discover Data Exfiltration 2
Another attacker has a job scheduled that export the contents of our internal wiki. One host is sending out much more data during off hours from the enterprise than the others, different from the host in the Question 1. What is its IP?
根據題目可以知道這次我們要找的就是在 off hours 送出 大量資料 的 IP 。
視覺化,觀察 24 小時中 傳輸次數 統計:
1
2
3df.groupby('hour').size()\
.plot.bar(title='Hour-Connect')\
.set_ylabel('Connection Count')1
Text(0, 0.5, 'Connection Count')
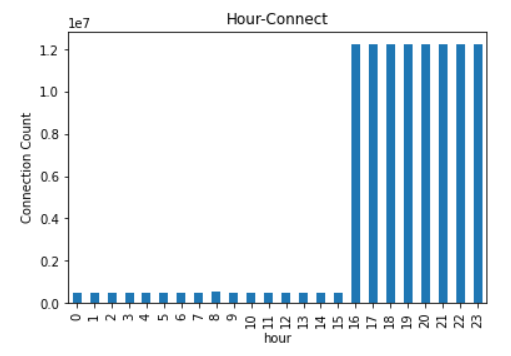
圖中可以猜測:
16:00~23:59 是上班時段。
00:00~15:59 是下班時段 ( off hours ) 。
查找出可疑 IP :
1
2
3
4
5
6
7
8
9
10
11
12
13
14
15off_hours_activity = df[
~df['src'].isin(blacklist_ips)
& df['src_int'] & ~df['dst_int']
& (df['hour'] >= 0) & (df['hour'] < 16)
].groupby('src')\
.bytes.sum()\
.pipe(lambda x : x[x > 0])\
.sort_values(ascending=False)
print(off_hours_activity.head(10))
off_hours_activity.head(10)\
.sort_values()\
.plot.barh(title='Outbound Traffic')\
.set_xlabel('Outbound Bytes')1
2
3
4
5
6
7
8
9
10
11
12
13src
12.55.77.96 289566918
13.48.72.30 120862595
14.51.30.86 116752466
12.59.25.34 115533918
14.51.75.107 112816919
12.56.32.111 111708846
12.58.68.102 108870195
14.57.50.29 108788348
13.39.46.94 107736632
12.45.94.34 106931217
Name: bytes, dtype: int64
Text(0.5, 0, 'Outbound Bytes')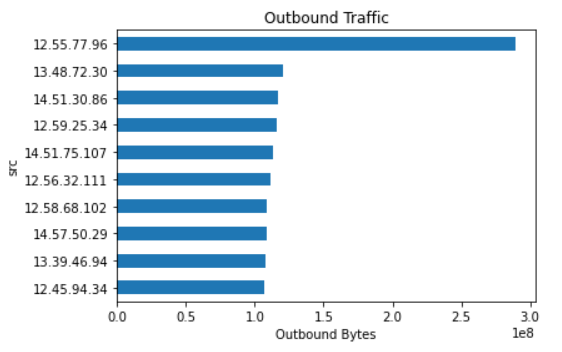
語法與之前類似。
圖中可以看到可疑的 IP 應該是
12.55.77.96。
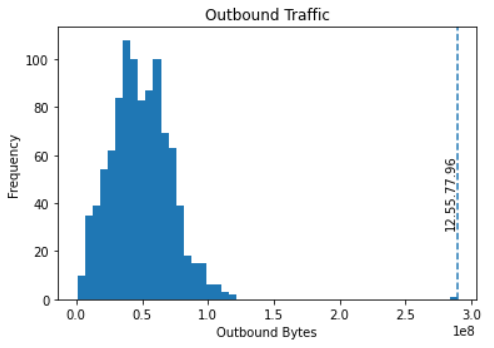
以頻率圖來視覺化分析結果:
1
2
3
4ax = off_hours_activity.plot.hist(bins=50, title='Outbound Traffic')
ax.set_xlabel('Outbound Bytes')
ax.axvline(off_hours_activity.iloc[0], linestyle='--')
plt.text(off_hours_activity.iloc[0], 30, '12.55.77.96', rotation=90, horizontalalignment='right')1
Text(289566918, 30, '12.55.77.96')
結合 Question 1 的結果,並且用所有的時段的 Outbound Traffic 來做比較:
1
2
3
4
5
6
7
8ax = src_bytes_out_2\
.plot.hist(bins=50, title='Outbound Traffic')
ax.set_xlabel('Outbound Bytes')
ax.axvline(src_bytes_out_2.iloc[0], linestyle='--')
print(plt.text(src_bytes_out_2.iloc[0], 75, '13.37.84.125', rotation=90, horizontalalignment='right'))
ax.axvline(src_bytes_out_2.loc['12.55.77.96'], color='orange', linestyle='--')
print(plt.text(src_bytes_out_2.loc['12.55.77.96'], 75, '12.55.77.96', rotation=90, horizontalalignment='right'))1
2Text(10625497574, 75, '13.37.84.125')
Text(1033651932, 75, '12.55.77.96')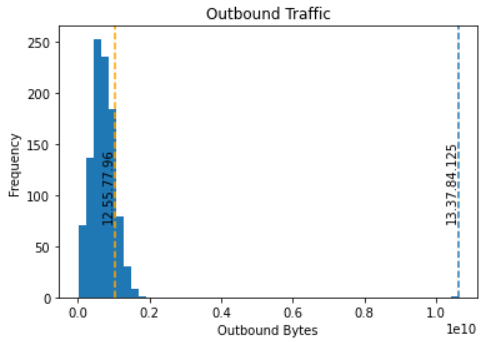
- 透過這樣的呈現方式,我們可以知道如果沒有加上 off hours 的條件,是不太可能透過流量直接找到
12.55.77.96的!因為它的流量統計在我們認定的 正常流量範圍 ,且從頻率也無法看出異常。
- 透過這樣的呈現方式,我們可以知道如果沒有加上 off hours 的條件,是不太可能透過流量直接找到
把答案記錄下來:
1
2
3gc.collect()
blacklist_ips.append('12.55.77.96')
answers.append('12.55.77.96')
Question 3: Discover Data Exfiltration 3
Some assailant is grabbing all the employee and vendor email addresses, and sending them out on a channel normally reserved for other uses. This is similar to attackers abusing DNS for data exfiltration. One host is sending out much more data on a some port from the enterprise than other hosts do, different from the hosts in Questions 1 and 2. What is its port?
根據題目可以知道這次我們的目標是找到某個 Host ( IP ) 上的某個異常 port ,且相較於其他 IP 的相同 port ,我們的目標送出了 大量資料 。注意到這邊的比較對象是 其他 IP 的相同 port !
一開始我們不太能直接查出是哪個 IP 有問題,因為關鍵的分析點在 port ( 題目是說 port 傳輸資料異常 ) 。如果我們先把有問題的 port 找出來,再推斷 IP 應該是哪個整體來說或許會比較好處理。
每個 port 的流量狀態都不太一樣,該如何找出 最異常 的 port ?我的想法是先觀察每個 port 的流量狀態分部圖,然後決定要用甚麼方式去衡量每個圖的 異常部分 並給定一個 可以與其他圖比較的值 ,從這些比較值中取出最突出者,該圖的代表的 port 或許就是我們的目標。
觀察 port 流量:
1
2
3
4
5
6
7
8
9
10
11
12
13
14
15
16
17src_port_bytes_df = df[
~df['src'].isin(blacklist_ips)
& df['src_int'] & ~df['dst_int']
].groupby(['src', 'port'])\
.bytes.sum()\
.pipe(lambda x : x[x > 0])\
.reset_index()
ports = src_port_bytes_df['port'].unique()
print(ports, "Total:", len(ports))
print(src_port_bytes_df.head(10))
src_port_bytes_df.groupby('port')\
.bytes.sum()\
.sort_values(ascending=False)\
.plot.bar(figsize=(16,4), rot=0, title="Outbound Traffic")\
.set_ylabel('Outbound Bytes')1
2
3
4
5
6
7
8
9
10
11
12
13
14
15[ 22 23 25 26 27 29 34 37 39 40 42 44 50 52 55 56 57 61
65 68 72 74 75 77 79 80 81 82 89 90 92 94 96 102 105 106
112 114 115 117 118 119 121 123 124 51] Total: 46
src port bytes
0 14.56.49.69 22 448629
1 14.56.49.69 23 479361
2 14.56.49.69 25 10080
3 14.56.49.69 26 464350
4 14.56.49.69 27 453729
5 14.56.49.69 29 15548680
6 14.56.49.69 34 464676
7 14.56.49.69 37 15817450
8 14.56.49.69 39 17388933
9 14.56.49.69 40 15583867
Text(0, 0.5, 'Outbound Bytes')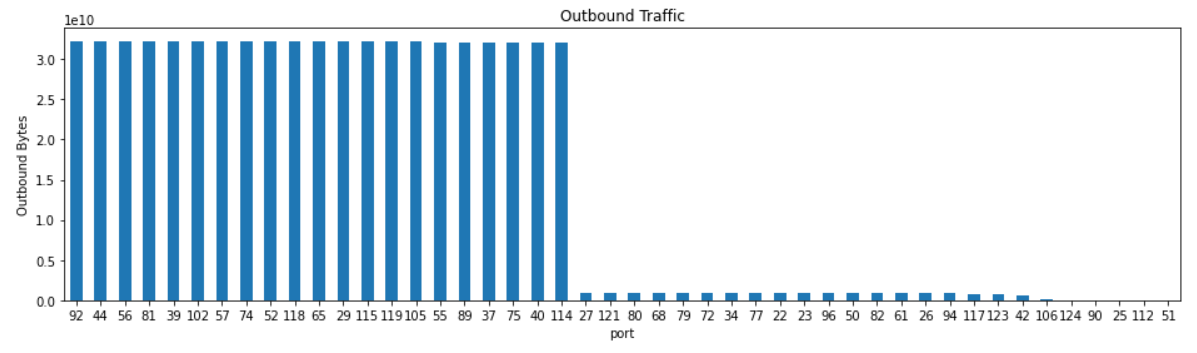
這邊先是把有 outbound traffic 的 source IP 以及其對應的 port 查尋出來。
接著印出 port 與其對應流量的圖,這張圖說明了有很多 port 都有很高的流量,可見不能單看總流量來判定是哪個 port 有問題。
之後要做的便是仔細觀察每個 port 的流量分部圖,找到可以衡量流量異常的方法!
觀察 port 流量細節,流量分部圖:
1
2
3
4
5
6
7
8fig, axs = plt.subplots(ncols=3, nrows=3, sharey=True, figsize=(12,6))
for idx, p in enumerate(src_port_bytes_df.port.head(9)):
src_port_bytes_df[src_port_bytes_df.port == p]\
.bytes.plot.hist(title='Port {}'.format(p), ax = axs[idx % 3][idx // 3])\
.set_xlabel('Outbound Bytes')
plt.tight_layout()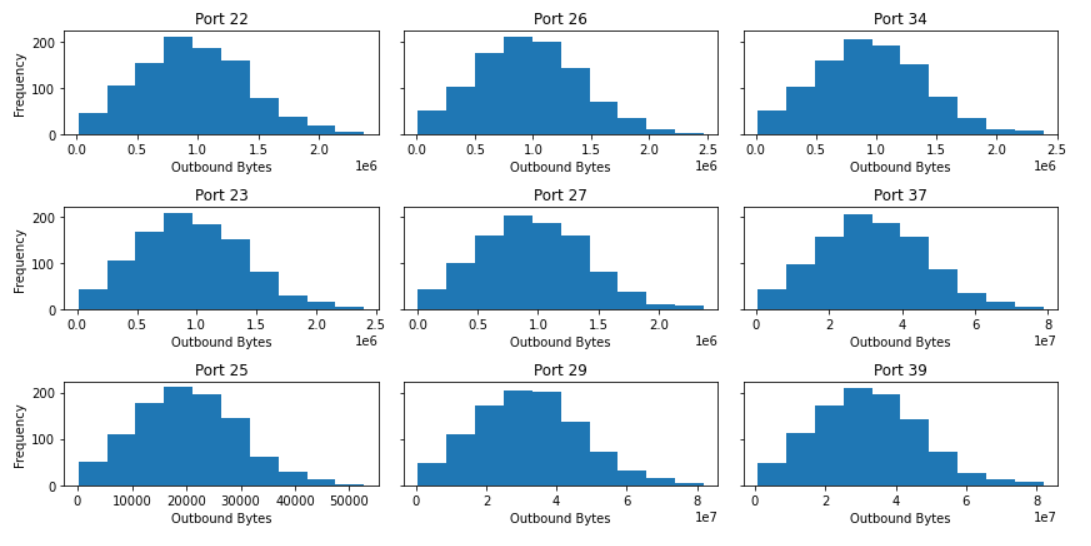
- 圖中列出部分 port 的流量分部圖,可以看到流量大致呈現鐘型分部,如果所有的 port 的流量分部都是呈現鐘型分部,那麼 z-score 會是一個不錯的衡量標準,我們可以找出哪個 port 的極端值是距離該圖最多個標準差的,也就是 z-score 最高者,該 port 或許就是我們的目標 port !
z-score 結果:
1
2
3
4
5
6
7src_port_bytes_df\
.groupby('port')\
.apply(lambda x: np.max((x.bytes - x.bytes.mean()) / x.bytes.std()))\
.sort_values()\
.tail(10)\
.plot.barh(title='Score')\
.set_xlabel('z-score')1
Text(0.5, 0, 'z-score')
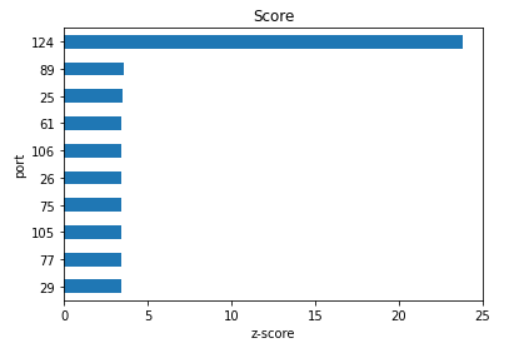
這邊補充一下:
.apply()與.pipe()不同的地方是.apply()會套用到物件中每個元素,而.pipe()則是直接套用整個物件。圖中可以很明顯看到 124 應該就是可疑的 port ,只要去查尋哪個 IP 影響這個 port 最多,就可以順便找到可疑的 IP 。
查尋 IP :
1
2
3
4
5src_124 = src_port_bytes_df\
.pipe(lambda x: x[x['port'] == 124])\
.sort_values('bytes', ascending=False)
print(src_124.head(10))1
2
3
4
5
6
7
8
9
10
11src port bytes
40972 12.30.96.87 124 356207
15352 13.48.72.30 124 51282
27466 14.51.75.107 124 47964
33592 14.51.30.86 124 47712
7066 13.39.46.94 124 47628
6301 12.59.25.34 124 46032
7246 12.58.68.102 124 45024
43357 12.56.32.111 124 44772
16792 14.36.60.74 124 44730
42772 14.57.50.29 124 44436- 這邊可以看到
12.30.96.87應該就是可疑的 IP 。
- 這邊可以看到
Port 124 的 Outbound Traffic 頻率圖:
1
2
3
4
5
6ax = src_port_bytes_df[src_port_bytes_df.port == 124]\
.bytes.plot.hist(bins=50, title='Port 124')
ax.set_xlabel('Outbound Bytes')
ax.axvline(src_124.iloc[0, 2], linestyle='--')
plt.text(src_124.iloc[0, 2], 75, '12.30.96.87', rotation=90, horizontalalignment='right')1
Text(356207, 75, '12.30.96.87')
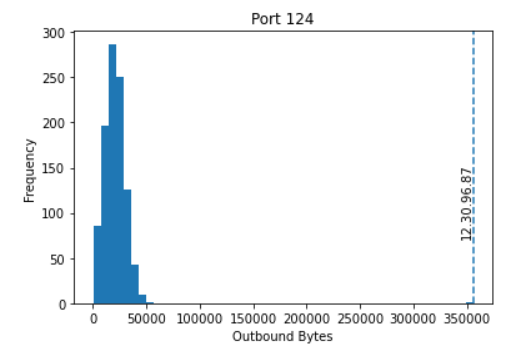
- 補充一下:
[0, 2]語法應該是第 0 個元素的第 2 個元素,所以src_124.iloc[0, 2]也就是 356207 。
- 補充一下:
把答案記錄下來:
1
2
3gc.collect()
blacklist_ips.append('12.30.96.87')
answers.append('124')
Question 4: Private C&C channel
We're always running a low-grade infection; some internal machines will always have some sort of malware. Some of these infected hosts phone home to C&C on a private channel. What unique port is used by external malware C&C to marshal its bots?
根據題意,我們的目標是找到被攻擊方利用的特別的 port 。
透過搜尋異常流量的方式不一定管用,因為攻擊方的目的應該是下達一些指令,控制他的 bots ,流量可能不會很明顯。
可以做一個猜測,那就是那個用來做壞事的特別的 port 可能只有攻擊方在使用,那這樣我們便可以透過尋找每個 port 的 使用人數 來篩選出可疑的 port 。
統計 port 的使用人數,也可以說是被幾個相異的 IP 使用:
1
2
3
4
5df[~df['src_int'] & df['dst_int']]\
.drop_duplicates(('src', 'port'))\
.groupby('port').size()\
.sort_values()\
.head(10)1
2
3
4
5
6
7
8
9
10
11
12port
113 1
90 4898
124 4903
42 4903
123 4904
117 4905
112 4911
25 4919
106 4922
72 4945
dtype: int64- 這邊可以看到 port 113 使用人數極少,只有 1 人,故 113 應該就是可疑的 port 。
繼續追查 IP :
1
print(df[~df['src_int'] & df['dst_int'] & (df['port'] == 113)][['src', 'dst', 'port']])
1
2
3
4
5
6
7
8
9
10
11
12
13
14
15
16
17
18
19
20
21
22
23
24src dst port
521103 15.104.76.58 12.45.104.32 113
8455408 15.104.76.58 12.54.109.102 113
10094540 15.104.76.58 12.44.90.114 113
14443402 15.104.76.58 13.46.43.95 113
16983638 15.104.76.58 14.41.54.105 113
20206698 15.104.76.58 14.40.73.39 113
22688530 15.104.76.58 13.34.88.95 113
23883205 15.104.76.58 13.43.104.74 113
28087393 15.104.76.58 12.33.73.55 113
29337719 15.104.76.58 13.34.89.21 113
29697525 15.104.76.58 13.30.55.77 113
31434981 15.104.76.58 13.44.73.37 113
32387869 15.104.76.58 13.52.101.31 113
37953699 15.104.76.58 14.30.32.122 113
39415621 15.104.76.58 13.39.45.30 113
64825734 15.104.76.58 14.43.103.75 113
65976771 15.104.76.58 13.56.119.33 113
66955446 15.104.76.58 13.51.24.117 113
94996259 15.104.76.58 14.50.119.33 113
95777941 15.104.76.58 13.34.68.110 113
98494120 15.104.76.58 12.41.62.22 113
100484752 15.104.76.58 14.41.120.94 113
103642547 15.104.76.58 14.47.74.88 113- 這邊可以觀察出
15.104.76.58應該就是可疑的 IP 。
- 這邊可以觀察出
把答案記錄下來:
1
2
3gc.collect()
blacklist_ips.append('15.104.76.58')
answers.append('113')
Question 5: Internal P2P
Sometimes our low-grade infection is visible in other ways. One particular virus has spread through a number of machines, which now are used to relay commands to each other. The malware has created an internal P2P network. What unique port is used by the largest internal clique, of all hosts talking to each other?
根據題意,我們的目標是要找到 Internal Host ( IP ) 裡面的 P2P Network ,題目又有提示到這個 Internal Host 連線圖裡最大的一個 clique ,而且這個 clique 裡面的 Host 應該都是用同一個 port 在溝通。
Clique 相關說明:
Clique :
完全子圖。
任兩點都有連邊的一個子圖。
Maximal Clique :
極大完全子圖。
不存在更大 Clique 包含的 Clique 。
Maximum Clique :
最大完全子圖。
最大的 Maximal Clique 。
定義 Internal Host 連線所形成的圖的 edge ,並且列出所有可能會使用的 port :
1
2
3
4
5
6
7
8internal_edges_all = df[
df['src_int'] & df['dst_int']
].drop_duplicates(['src', 'dst', 'port'])
internal_ports = internal_edges_all.port.unique()
print(internal_edges_all)
print(internal_ports)1
2
3
4
5
6
7
8
9
10
11
12
13
14
15
16
17
18
19
20
21
22
23
24
25
26
27
28
29
30timestamp src dst port bytes \
9 2020-01-06 16:00:00.021 14.32.60.107 12.30.62.113 72 1036
15 2020-01-06 16:00:00.025 14.49.89.121 12.42.30.44 114 2462
18 2020-01-06 16:00:00.035 14.32.69.91 13.58.72.67 57 36215
30 2020-01-06 16:00:00.048 12.48.32.126 12.56.47.110 80 1018
33 2020-01-06 16:00:00.052 13.37.55.112 13.57.76.27 92 15941
... ... ... ... ... ...
105696553 2020-01-11 16:00:00.998 12.33.69.54 12.47.47.34 121 784
105696663 2020-01-11 16:00:53.777 12.49.123.62 13.50.37.48 22 763
105701686 2020-01-11 16:42:35.956 12.48.81.33 13.37.51.62 83 961
105707383 2020-01-11 17:29:51.463 13.34.23.71 14.39.88.102 83 1052
105708928 2020-01-11 17:42:43.896 14.54.110.71 13.47.22.97 83 1227
src_int dst_int hour minute
9 True True 16 0
15 True True 16 0
18 True True 16 0
30 True True 16 0
33 True True 16 0
... ... ... ... ...
105696553 True True 16 0
105696663 True True 16 0
105701686 True True 16 42
105707383 True True 17 29
105708928 True True 17 42
[7469743 rows x 9 columns]
[ 72 114 57 80 92 56 27 79 82 89 39 81 123 52 118 115 102 75
105 65 106 119 23 37 121 117 26 96 61 90 112 25 22 74 77 50
68 34 55 29 42 44 40 94 124 83]- 以
['src', 'dst', 'port']來定義 IP 連線圖的邊 ( edge ) ,接著抓出可能使用的 port 。
- 以
現在我們有 IP 連線圖了,接著可以根據 port 來找出用哪個 port 所連接起來的 Clique 是最大的,也就是說要針對每個 port 找出 Maximum Clique ,再來比較哪個 port 的 Maximum Clique 是最大的。
在計算每個 port 的 Maximum Clique 之前,我們可以做一些前置動作來加快之後 Maximal Clique 的尋找。先把 可能的最大 Clique 算出來。
計算每個 port 可能的最大 Clique :
1
2
3
4
5
6
7
8
9
10
11
12
13
14
15
16
17
18
19
20
21
22
23
24
25
26
27
28
29
30
31
32
33
34
35
36
37from collections import Counter
port_upper_bounds = []
for p in internal_ports:
internal_edges = internal_edges_all\
.pipe(lambda x: x[x['port'] == p])
edges = set()
for l, r in zip(internal_edges.src, internal_edges.dst):
if l == r:
continue
k = min((l, r), (r, l))
edges.add(k)
degrees = Counter()
for (l, r) in edges:
degrees[l] += 1
degrees[r] += 1
max_clique_size = 0
min_degrees = len(degrees)
for idx, (node, degree) in enumerate(degrees.most_common()):
min_degrees = min(min_degrees, degree)
if min_degrees >= idx:
max_clique_size = max(max_clique_size, idx+1)
if min_degrees < max_clique_size:
break
port_upper_bounds.append((p, max_clique_size))
print("port_upper_bounds:", port_upper_bounds)
port_upper_bounds.sort(key = lambda x: -x[-1])
print(port_upper_bounds[:5])
print(-port_upper_bounds[0][-1])1
2
3port_upper_bounds: [(72, 202), (114, 203), (57, 202), (80, 202), (92, 202), (56, 202), (27, 202), (79, 202), (82, 202), (89, 203), (39, 202), (81, 202), (123, 201), (52, 202), (118, 203), (115, 203), (102, 203), (75, 203), (105, 202), (65, 203), (106, 201), (119, 202), (23, 202), (37, 202), (121, 202), (117, 201), (26, 202), (96, 202), (61, 202), (90, 201), (112, 201), (25, 201), (22, 202), (74, 202), (77, 202), (50, 202), (68, 202), (34, 202), (55, 203), (29, 203), (42, 201), (44, 203), (40, 203), (94, 202), (124, 200), (83, 263)]
[(83, 263), (114, 203), (89, 203), (118, 203), (115, 203)]
-263第 1 層 for loop 內的細節說明:
篩選出特定 port
p:1
2internal_edges = internal_edges_all\
.pipe(lambda x: x[x['port'] == p])建立 edge 且避免重複:
1
2
3
4
5
6edges = set()
for l, r in zip(internal_edges.src, internal_edges.dst):
if l == r:
continue
k = min((l, r), (r, l))
edges.add(k)紀錄 degrees ,也就是紀錄圖中每個 node ( 這邊也就是 IP ) 所連接的 edge 的個數:
1
2
3
4degrees = Counter()
for (l, r) in edges:
degrees[l] += 1
degrees[r] += 1len(degrees)可以想成該圖中 node ( IP ) 數量。
第 2 層 for loop 內的細節說明:
這裡有產生可能的最大的 Clique 的實作邏輯。
每次迴圈都會有
idx, (node, degree),而這 3 個是由enumerate(degrees.most_common())產生。idx + 1是 index + 1 但可以想成到目前為止加入了多少個 node ,後面應該會做解釋。node代表現在正在處理哪個 IP 。degree該 node ( IP ) 的 degree ,.most_common()會把degree由大到小排列。程式會一直以目前最小的
degree來更新min_degree:1
min_degrees = min(min_degrees, degree)
只要
min_degrees >= idx就會去更新max_clique_size的值,idx+1可以想像成到現在為止,加入了多少 node 到我們的可能的最大 Clique 的猜測中。如果要假設可能的最大的 Clique 要想說比較小的
degree的node一定會連到比他更大的degree的node所連結到的地方!這樣一來每過一次迴圈就可以想成又新納入一個 node 到可能的最大的 Clique ,而中止條件就是min_degrees < idx( 不能再納入新的 node 因為本身的 degree 已經小於已納入的 node ) 且min_degrees < max_clique_size的時候。為何可以說
min_degrees < idx就不能再納入新的 node ?這是因為一個 Clique 如果有K個 node 那每個 node 的 degree 都會是>= K-1,要加入一個新的 node 到 Clique 就必須要符合這個條件。
把我們算出來的每個 port 的可能的最大的 Clique 代到計算 Maximum Clique 的程式碼中:
1
2
3
4
5
6
7
8
9
10
11
12
13
14
15
16
17
18
19
20
21
22
23
24import networkx
from networkx.algorithms.approximation.clique import large_clique_size
max_port = 0
curr_max_clique = 0
for p, max_clique_upper_bound in port_upper_bounds:
if curr_max_clique > max_clique_upper_bound:
break
internal_edges = internal_edges_all\
.pipe(lambda x: x[x['port'] == p])
internal_nodes = set(internal_edges.src) | set(internal_edges.dst)
G = networkx.Graph()
G.add_nodes_from(internal_nodes)
for l, r in zip(internal_edges.src, internal_edges.dst):
G.add_edge(l, r)
lcs_G = large_clique_size(G)
if curr_max_clique < lcs_G:
curr_max_clique = lcs_G
max_port = p
print(max_port, curr_max_clique)1
83 264
這邊可以看到可疑的 port 應該就是 83 。
這邊 264 這個數值跟我之前計算的 263 不太一樣但基本上接近,目前不確定是哪個環節沒處理好 QQ ,不過以結果來看我還是找到了 83 這個可疑的 port 。
把答案記錄下來:
1
2gc.collect()
answers.append("83")
Question 6: Malware Controller
We were just blacklisted by an IP reputation service, because some host in our network is behaving badly. One host is a bot herder receiving C&C callbacks from its botnet, which has little other reason to communicate with hosts in the enterprise. What is its IP?
這題的目標是在 Internal Host ( IP ) 中找出一個接收大量許多外面的 IP 連線的主機 IP 。
篩選連線:
1
2
3
4
5
6
7single_dst_df = df[~df['src_int'] & df['dst_int']]\
.drop_duplicates(['src', 'dst'])\
.src.value_counts()\
.pipe(lambda x: x[x == 1])\
.index
print(single_dst_df)1
2
3
4
5
6
7
8
9CategoricalIndex(['17.102.25.55', '16.101.98.39', '19.89.121.63',
'15.112.29.111', '17.105.23.53', '16.41.92.57',
'17.40.52.37', '19.57.43.28', '17.114.26.126',
'17.102.21.125',
...
'15.87.89.27', '18.57.106.67', '16.16.28.29', '19.75.84.23',
'17.95.61.34', '17.68.79.43', '18.18.75.100', '17.73.89.103',
'19.110.27.46', '18.115.94.38'],
categories=['12.58.76.101', '17.101.96.114', '17.88.119.67', '19.94.120.85', '12.49.48.29', '16.40.36.78', '12.48.64.37', '18.26.113.46', ...], ordered=False, dtype='category', length=172)- 這邊篩選了由外到內且指向 1 個特定 IP 的連線。
找出那些連線都連到哪個 Internal Host :
1
2
3
4
5df[~df['src_int'] & df['dst_int']\
& df['src'].isin(single_dst_df)]\
.drop_duplicates(['src', 'dst'])\
.groupby('dst').size()\
.where(lambda x: x > 0).dropna()1
2
3dst
14.45.67.46 172.0
dtype: float6414.45.67.46應該就是答案。
把答案記錄下來:
1
2
3gc.collect()
blacklist_ips.append('14.45.67.46')
answers.append('14.45.67.46')
Question 7: Infected Host
One host is part of the botnet from Question 6, what is its IP?
接續 Question 6 ,這題目標是要找到在 Internal Host 中的 botnet 成員。
可以先觀察之前 botnet 的機器是透過什麼 port 來連到
14.45.67.46:1
2
3
4
5
6check_port_df = df[~df['src_int'] & df['dst_int']\
& df['src'].isin(single_dst_df)]\
.drop_duplicates(['src', 'dst'])\
.head(10)
print(check_port_df)1
2
3
4
5
6
7
8
9
10
11
12
13
14
15
16
17
18
19
20
21
22
23timestamp src dst port bytes \
14608704 2020-01-06 21:59:50.350 18.50.110.105 14.45.67.46 27 941
14611627 2020-01-06 21:59:54.799 19.125.42.108 14.45.67.46 27 877
14612007 2020-01-06 21:59:55.336 19.112.61.90 14.45.67.46 27 931
14612050 2020-01-06 21:59:55.401 15.67.125.70 14.45.67.46 27 1147
14612053 2020-01-06 21:59:55.401 19.92.34.40 14.45.67.46 27 913
14612060 2020-01-06 21:59:55.408 15.62.112.58 14.45.67.46 27 995
14612456 2020-01-06 21:59:56.015 17.102.21.125 14.45.67.46 27 976
14613022 2020-01-06 21:59:56.828 16.24.77.68 14.45.67.46 27 1097
14613146 2020-01-06 21:59:57.004 15.32.22.108 14.45.67.46 27 652
14613239 2020-01-06 21:59:57.149 17.105.78.122 14.45.67.46 27 966
src_int dst_int hour minute
14608704 False True 21 59
14611627 False True 21 59
14612007 False True 21 59
14612050 False True 21 59
14612053 False True 21 59
14612060 False True 21 59
14612456 False True 21 59
14613022 False True 21 59
14613146 False True 21 59
14613239 False True 21 59- 可以看到是透過 port 27 來連線。
篩選 Internal IP :
1
2
3
4
5
6
7bad_host_df = df[
df['src_int'] & df['dst_int']
& (df['dst'] == '14.45.67.46')
& (df['port'] == 27)
]
print(bad_host_df)1
2
3
4
5
6
7
8
9
10
11timestamp src dst port bytes \
14623736 2020-01-06 22:00:12.552 14.51.84.50 14.45.67.46 27 902
56910312 2020-01-08 22:00:00.821 14.51.84.50 14.45.67.46 27 944
62683180 2020-01-09 08:34:32.855 13.42.70.40 14.45.67.46 27 979
99230632 2020-01-10 22:00:12.456 14.51.84.50 14.45.67.46 27 1043
src_int dst_int hour minute
14623736 True True 22 0
56910312 True True 22 0
62683180 True True 8 34
99230632 True True 22 0- 這邊比較可疑的 IP 應該是我選出現比較多次的
14.51.84.50。
- 這邊比較可疑的 IP 應該是我選出現比較多次的
把答案記錄下來:
1
2
3gc.collect()
blacklist_ips.append('14.51.84.50')
answers.append('14.51.84.50')
Question 8: Botnet Inside
There is a stealthier botnet in the network, using low frequency periodic callbacks to external C&C, with embedded higher frequency calls. What port does it use?
這題我直接找最少使用的 port :
1
2df[(df['src_int'] & ~df['dst_int'])]\
.groupby('port').size().sort_values().head(10)1
2
3
4
5
6
7
8
9
10
11
12port
51 107
31 348
32 5564
78 5640
21 5671
95 5672
36 5778
123 481275
42 481672
112 481942
dtype: int64把答案記錄下來:
1
2gc.collect()
answers.append("51")
Question 9: Lateral Brute
Once a machine is popped, it's often used to explore what else can be reached. One host is being used to loudly probe the entire enterprise, trying to find ways onto every other host in the enterprise. What is its IP?
這題直接找發起連線次數最多的就好了:
1
2
3
4
5df[df['src_int'] & df['dst_int']]\
.drop_duplicates(['src', 'dst'])\
.groupby('src').size()\
.sort_values(ascending=False)\
.head(10)1
2
3
4
5
6
7
8
9
10
11
12src
13.42.70.40 999
13.37.84.125 417
14.42.99.114 417
14.47.69.45 417
13.39.93.73 417
13.50.37.48 417
13.31.71.38 417
12.56.101.50 417
14.42.109.95 417
14.52.75.82 417
dtype: int64把答案記錄下來:
1
2
3gc.collect()
blacklist_ips.append('13.42.70.40')
answers.append('13.42.70.40')
Question 10: Lateral Spy
One host is trying to find a way onto every other host more quietly. What is its IP?
這題要找比較難直接看出找到但是也在掃瞄 Internal Host 的 Internal Host 。
找有只有單一 source 的連線群,統計連線數量看看是否像是在作掃描 IP 的動作:
1
2
3
4
5
6
7
8
9
10df[df['src_int'] & df['dst_int'] & ~df['src'].isin(blacklist_ips)]\
.drop_duplicates(['src', 'dst', 'port'])\
.groupby(['dst', 'port'])\
.src\
.apply(list)\
.dropna()\
.pipe(lambda x: x[x.map(len) == 1])\
.to_frame()\
.explode('src')\
.src.value_counts()1
212.49.123.62 5097
Name: src, dtype: int64- 這邊可以看到
12.49.123.62發起了許多對內的連線,像是在作掃描。
- 這邊可以看到
把答案記錄下來:
1
2
3gc.collect()
blacklist_ips.append('12.49.123.62')
answers.append('12.49.123.62')
Final Check
Answer Hash is ec766132cac80b821793fb9e7fdfd763 .
我的答案:
1
2print(blacklist_ips)
print(answers)1
2['13.37.84.125', '12.55.77.96', '12.30.96.87', '15.104.76.58', '14.45.67.46', '14.51.84.50', '13.42.70.40', '12.49.123.62']
['13.37.84.125', '12.55.77.96', '124', '113', '83', '14.45.67.46', '14.51.84.50', '51', '13.42.70.40', '12.49.123.62']檢查答案:
1
2
3
4
5
6import hashlib
answer_hash = hashlib.md5(':'.join(answers).encode('utf-8')).hexdigest()
if answer_hash == 'ec766132cac80b821793fb9e7fdfd763':
print("Correct!!!")
else:
print("Wrong QQ...")1
Correct!!!
參考資源
https://pberba.github.io/security/2019/10/08/data-exfiltration/
https://pberba.github.io/security/2020/04/26/lateral-movement/
https://www.kaggle.com/code/hawkcurry/data-analysis-for-network-security-101-questions/notebook
https://www.kaggle.com/code/hawkcurry/data-analysis-for-network-security-101-solution/notebook